DESCRPTION
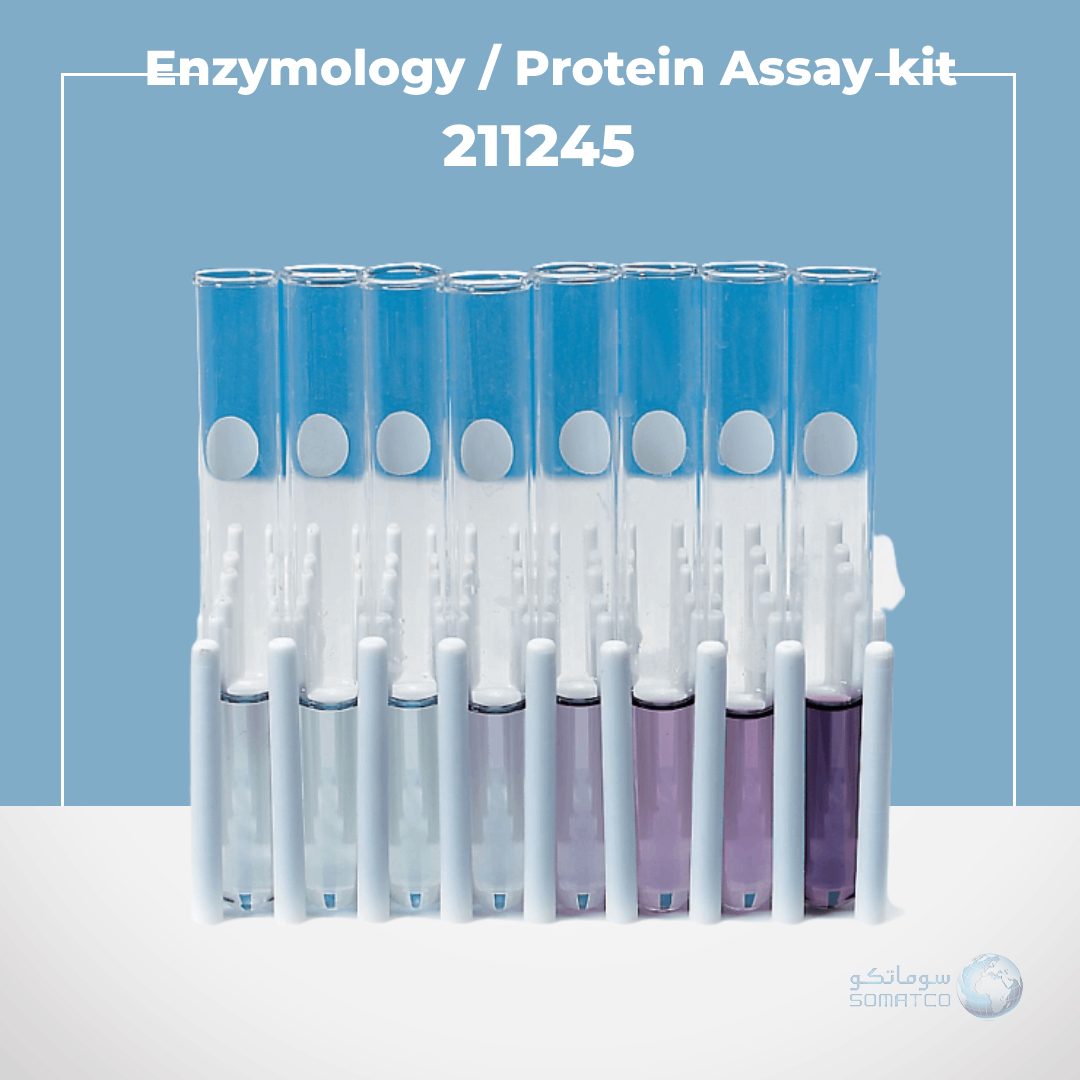
Students use a standard curve to analyze data in this experiment. They gather data by performing a BCA assay to determine the amount of protein in a standard versus 3 different food samples (included). Optionally, they can supply and test a fourth liquid food sample of their choosing. A spectrophotometer is used to obtain numerical values and absorbances of dilutions of the standard and the samples. Students graph absorbance versus protein concentration for the standard and use the resulting curve to interpolate the concentration of protein in the samples. Kit includes enough materials for 8 stations of students.




Reviews
There are no reviews yet.